A normal blood test result might not be normal for you
Personalizing the most common lab test used in medicine, the complete blood count, may improve diagnosis and care.Media Contact: Leila Gray, 206-475-9809, leilag@uw.edu
Personalizing the most common lab test used in medicine, the complete blood count, may improve diagnosis and care.
The range of values used to interpret the results of the most common blood test used in medicine — the complete blood count — may be too wide to detect important changes in an individual’s health, a new study has found.
Using a far narrower range based on an individual’s blood counts over time might make the test far better at detecting disease, the authors suggest. Their study results appeared Dec. 11 in the journal Nature.
“The range of what is normal for this test is based on what is normal across a large population, but the range that is normal for each individual appears to be much smaller,” said first author Brody Foy, assistant professor of laboratory medicine and pathology at the University of Washington School of Medicine in Seattle. “So, if we can work out what range is normal for an individual, we may be able to personalize the test to make it more likely it can assess an individual’s health and detect disease.”
Foy is a mathematician who develops computer programs to improve clinical tests. He began working on the project as a research scientist at Massachusetts General Hospital in Boston. Dr. John Higgins in the hospital’s Department of Pathology is the paper’s senior author.
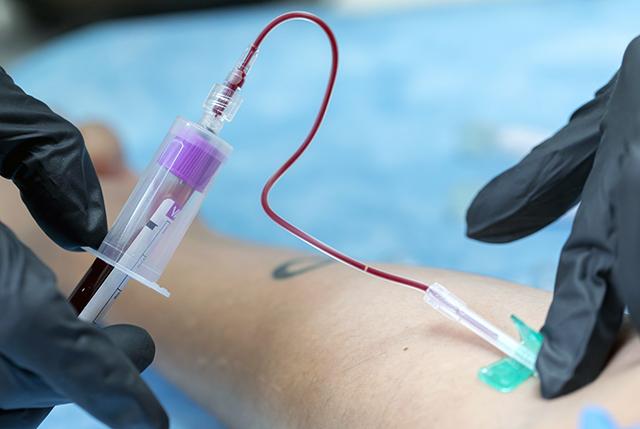
The complete blood count measures the concentrations of red and white blood cells and the small, clot-forming blood components called platelets. It also provides information about the type of white cells present and the size and hemoglobin content of the red blood cells.
A rise in the white cell count, for example, may indicate an infection or autoimmune disorder, while a fall in red blood cell count might indicate intestinal bleeding, an iron deficiency or bone marrow disorder. Because the test can help detect such a wide range of disorders, it is often part of a routine checkup and used extensively to manage a patient’s care.
A count is considered normal if the results fall within a range of high and low values. This range is based on levels found in the middle 95% of a healthy population. For example, in a population of healthy individuals, platelet counts range from 150 to 400 billion cells per liter of blood, so a platelet count within that range is considered normal.
Previous research, however, found that the complete blood counts of healthy individual patients usually do not vary over such wide ranges. Levels may go up and down a bit over time but appear to hover around the same level that researchers called the patient’s setpoint.
To find out whether this was true over the long term, Foy and his colleagues analyzed lab results from tens of thousands of healthy patients for whom they had a series of complete blood counts taken over two decades.
They found that, although there were significant differences in the values among the group of patients studied, an individual’s values tended to remain near a personal setpoint year after year.
“The range around these set points turns out to be about one-third as wide as the range seen in populations,” Foy said.
The findings suggest that a test result within what is now considered the normal range might be outside the normal range for an individual, he said. For example, if a patient’s white cell count usually runs near the bottom of the normal range, a new test result near the top of the range might indicate an infection or some other disorder even though the result is within normal parameters.
A person’s setpoint is probably determined by a combination of genetics, general health, and environmental factors such as diet, Foy said.
An analysis of medical records of the patients whose tests were included in the study found that an individual’s setpoint can also indicate risk for certain diseases, including heart attack, stroke, diabetes, kidney disease and osteoporosis.
Patients who had relatively high setpoints for white cells, for example, were more likely to develop type 2 diabetes. They were also twice as likely to die of any cause, compared with similar patients with low white cell setpoints.
In the future, Foy suggested, it might be possible to identify patients’ individual setpoints for complete blood counts and other common lab tests, thereby improving diagnoses and allowing for more personalized care.
The National Institute of Health (grants R01HD104756 and R01DK123330) funded the study.
Written by Michael McCarthy
For details about UW Medicine, please see our About page.